Read Article INTERVIEW: Brent Spiner Talks Getting the Bridge Back Together on ‘Star Trek: Picard’ Category: TV TV INTERVIEW: Brent Spiner Talks Getting the Bridge Back Together on ‘Star Trek: Picard’
Read Article Did You Catch The <em>Nemesis</em> and <em>Next Generation</em> Callbacks in <em>Star Trek: Picard</em>? Category: TV TV Did You Catch The Nemesis and Next Generation Callbacks in Star Trek: Picard? Jessica Mason Jessica Mason Jan 23, 2020
Read Article Things We Saw Today: Brent Spiner’s Offhand Comment About Lt. Commander Data’s Sexual Exploits Cracks Me Up Category: AMP Featured AMP Featured Big on the Internet Big on the Internet Things We Saw Today: Brent Spiner’s Offhand Comment About Lt. Commander Data’s Sexual Exploits Cracks Me Up Kaila Hale-Stern Kaila Hale-Stern Aug 23, 2019
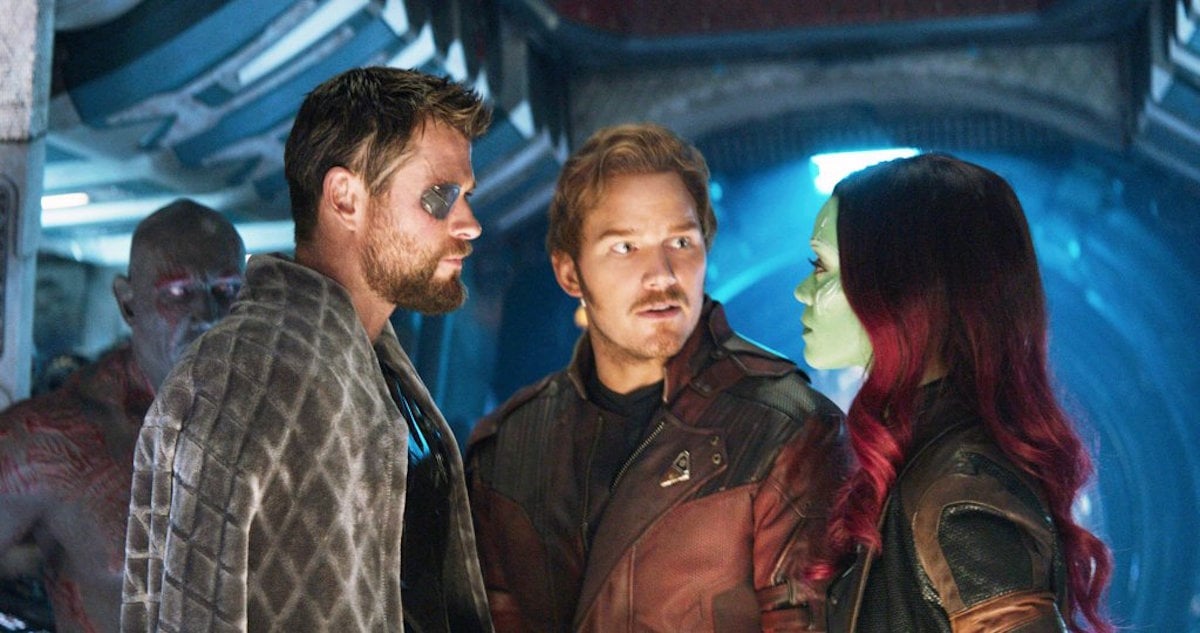
Read Article Who Actually Had the Most Lines in <em>Avengers: Infinity War</em>? Category: Movies Movies Who Actually Had the Most Lines in Avengers: Infinity War? Kaila Hale-Stern Kaila Hale-Stern Nov 27, 2018
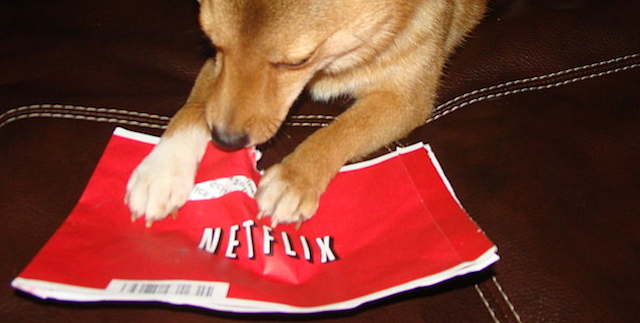
Read Article Should We Care That Netflix Knows Everything About Our Viewing Habits? Category: Technology Technology Should We Care That Netflix Knows Everything About Our Viewing Habits? Kaila Hale-Stern Kaila Hale-Stern Dec 12, 2017
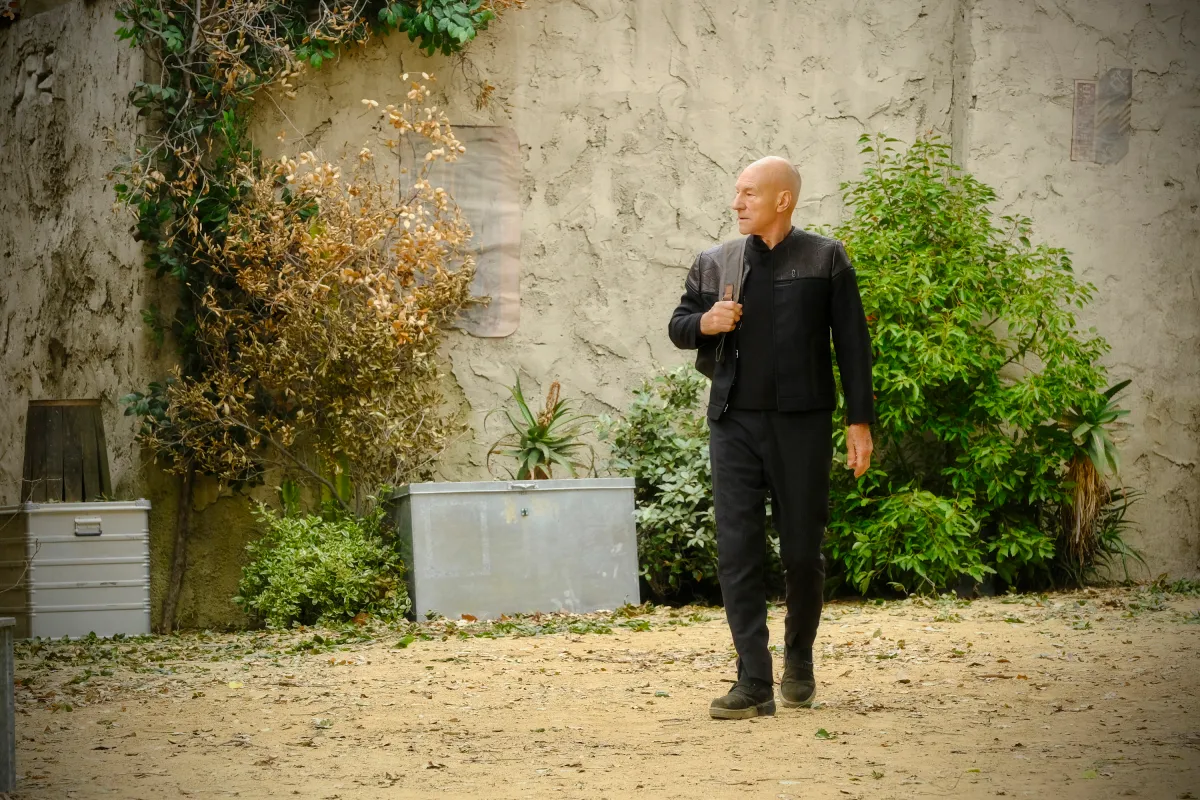
Read Article INTERVIEW: Brent Spiner Talks Getting the Bridge Back Together on ‘Star Trek: Picard’ Category: TV TV INTERVIEW: Brent Spiner Talks Getting the Bridge Back Together on ‘Star Trek: Picard’ Rachel Leishman Rachel Leishman Apr 13, 2023
Read Article Did You Catch The <em>Nemesis</em> and <em>Next Generation</em> Callbacks in <em>Star Trek: Picard</em>? Category: TV TV Did You Catch The Nemesis and Next Generation Callbacks in Star Trek: Picard? Jessica Mason Jessica Mason Jan 23, 2020
Read Article Things We Saw Today: Brent Spiner’s Offhand Comment About Lt. Commander Data’s Sexual Exploits Cracks Me Up Category: AMP Featured AMP Featured Big on the Internet Big on the Internet Things We Saw Today: Brent Spiner’s Offhand Comment About Lt. Commander Data’s Sexual Exploits Cracks Me Up Kaila Hale-Stern Kaila Hale-Stern Aug 23, 2019
Read Article Who Actually Had the Most Lines in <em>Avengers: Infinity War</em>? Category: Movies Movies Who Actually Had the Most Lines in Avengers: Infinity War? Kaila Hale-Stern Kaila Hale-Stern Nov 27, 2018
Read Article Should We Care That Netflix Knows Everything About Our Viewing Habits? Category: Technology Technology Should We Care That Netflix Knows Everything About Our Viewing Habits? Kaila Hale-Stern Kaila Hale-Stern Dec 12, 2017
Read Article Mapping the Country’s Differing TV Tastes Is Too Confusing For Our Binary-Driven Brains to Handle Category: TV TV Mapping the Country’s Differing TV Tastes Is Too Confusing For Our Binary-Driven Brains to Handle Vivian Kane Vivian Kane Dec 29, 2016
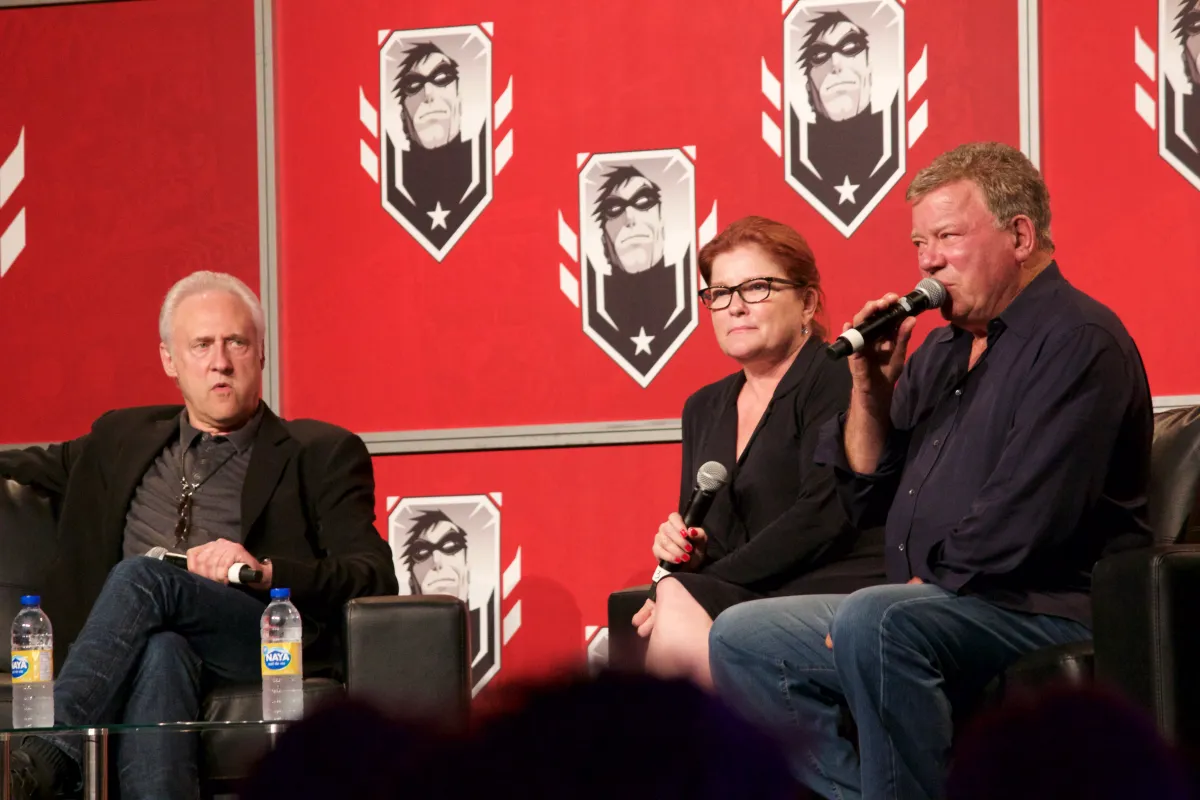
Read Article William Shatner Says, “A Woman’s Place Is in the Fridge,” Remains the Worst Category: Contributors Contributors William Shatner Says, “A Woman’s Place Is in the Fridge,” Remains the Worst Sam Riedel Sam Riedel Jul 18, 2016
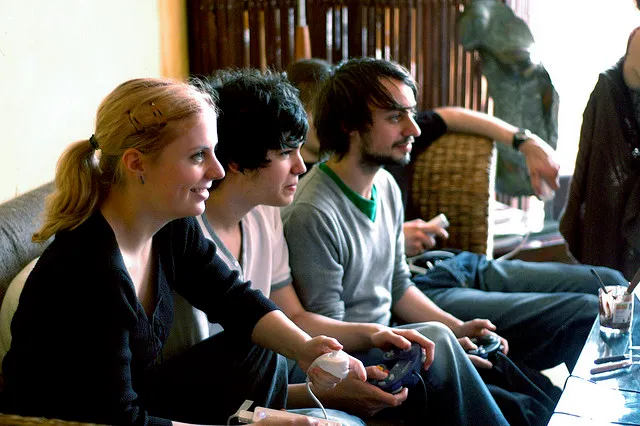
Read Article Adult Women Now Make Up Half of All Gamers, Outnumber Boys Under 18 Years Old Category: Gaming Gaming Adult Women Now Make Up Half of All Gamers, Outnumber Boys Under 18 Years Old Victoria McNally Victoria McNally Aug 22, 2014
Read Article New Tool Can Tell How Much Your Email’s Worth to Hackers Category: Technology Technology New Tool Can Tell How Much Your Email’s Worth to Hackers Maia Brown-Jackson Maia Brown-Jackson Jun 28, 2013
Read Article Twitter Analytics Now More Granular, Fans of Buzzwords Everywhere Overjoyed Category: Technology Technology Twitter Analytics Now More Granular, Fans of Buzzwords Everywhere Overjoyed Maia Brown-Jackson Maia Brown-Jackson Jun 14, 2013
Read Article See What Other People Are Watching With YouTube Trends Map Category: Technology Technology See What Other People Are Watching With YouTube Trends Map Ian Chant Ian Chant May 7, 2013
Read Article Digging Into Big Data: Watch the O’Reilly Strata Conference Live Here Category: Technology Technology Digging Into Big Data: Watch the O’Reilly Strata Conference Live Here Ian Chant Ian Chant Feb 27, 2013
Read Article 5 Out of 5, Would Watch Again…And Again And Again: Our Favorite Star Trek Characters Category: Movies & TV Movies & TV 5 Out of 5, Would Watch Again…And Again And Again: Our Favorite Star Trek Characters Ian Chant Ian Chant Dec 13, 2012
Read Article Mannequin Spies May be Dressing You With Their Camera-Eyes Category: Technology Technology Mannequin Spies May be Dressing You With Their Camera-Eyes Mike Epstein Mike Epstein Nov 25, 2012
Read Article INTERVIEW: Brent Spiner Talks Getting the Bridge Back Together on ‘Star Trek: Picard’ INTERVIEW: Brent Spiner Talks Getting the Bridge Back Together on ‘Star Trek: Picard’ Rachel Leishman Rachel Leishman Apr 13, 2023
Read Article Who Actually Had the Most Lines in <em>Avengers: Infinity War</em>? Who Actually Had the Most Lines in Avengers: Infinity War? Kaila Hale-Stern Kaila Hale-Stern Nov 27, 2018
Read Article William Shatner Says, “A Woman’s Place Is in the Fridge,” Remains the Worst William Shatner Says, “A Woman’s Place Is in the Fridge,” Remains the Worst Sam Riedel Sam Riedel Jul 18, 2016
Read Article Adult Women Now Make Up Half of All Gamers, Outnumber Boys Under 18 Years Old Adult Women Now Make Up Half of All Gamers, Outnumber Boys Under 18 Years Old Victoria McNally Victoria McNally Aug 22, 2014
Read Article The World’s Most Common Flag Colors, in Infographic Form The World’s Most Common Flag Colors, in Infographic Form Robert Quigley Robert Quigley Mar 15, 2010