Read Article A Brief History of Web Standards [Infographic] Category: Technology Technology A Brief History of Web Standards [Infographic] James Plafke James Plafke Oct 26, 2011
Read Article The Perks of Working at Tech Giants [Infographic] Category: Technology Technology The Perks of Working at Tech Giants [Infographic] James Plafke James Plafke Oct 17, 2011
Read Article Farewell to a Genius: The Life of Steve Jobs [Infographic] Category: Technology Technology Farewell to a Genius: The Life of Steve Jobs [Infographic] James Plafke James Plafke Oct 12, 2011
Read Article The Reddit Invasion [Infographic] Category: Technology Technology The Reddit Invasion [Infographic] James Plafke James Plafke Oct 6, 2011
Read Article Competitive Eating: An Unbalanced Diet [Infographic] Category: Science Science Competitive Eating: An Unbalanced Diet [Infographic] James Plafke James Plafke Oct 4, 2011
Read Article The Profile of Video-Sharing Users in America [Infographic] Category: Movies & TV Movies & TV The Profile of Video-Sharing Users in America [Infographic] James Plafke James Plafke Sep 28, 2011
Read Article The Psychological Appeal of Angry Birds [Infographic] Category: Science Science The Psychological Appeal of Angry Birds [Infographic] James Plafke James Plafke Sep 13, 2011
Read Article What's the Deal with Daily Deals? [Infographic] Category: Big on the Internet Big on the Internet What's the Deal with Daily Deals? [Infographic] James Plafke James Plafke Sep 12, 2011
Read Article The Untold Tales of Software Piracy [Infographic] Category: Technology Technology The Untold Tales of Software Piracy [Infographic] James Plafke James Plafke Sep 6, 2011
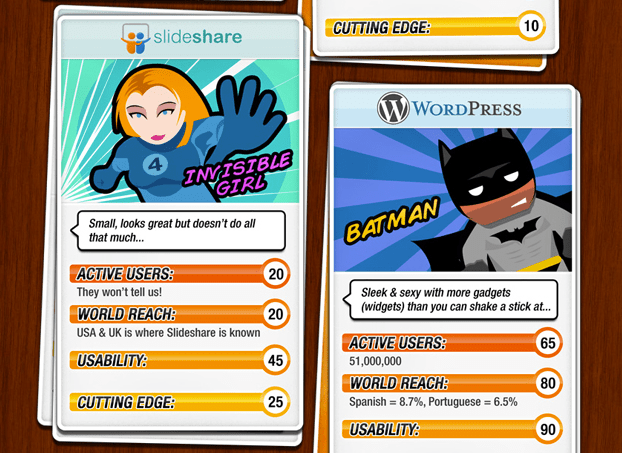
Read Article Superheroes and Their Social Network Counterparts [Infographic] Category: Uncategorized Uncategorized Superheroes and Their Social Network Counterparts [Infographic] Jamie Frevele Jamie Frevele Aug 6, 2011
Read Article One Blogger Watched All 117 Episodes of Modern-Day <em>Doctor Who</em> And Analyzed How Many Times It Passed the Bechdel Test One Blogger Watched All 117 Episodes of Modern-Day Doctor Who And Analyzed How Many Times It Passed the Bechdel Test Sam Maggs Sam Maggs Mar 9, 2015
Read Article Your Burning Questions About the Big Pile of Money in Breaking Bad, Now Answered [Infographic] Your Burning Questions About the Big Pile of Money in Breaking Bad, Now Answered [Infographic] Victoria McNally Victoria McNally Sep 18, 2013
Read Article The Rules of Magic, According to… Well, Everything, Ever The Rules of Magic, According to… Well, Everything, Ever Susana Polo Susana Polo Dec 8, 2011
Read Article How Does the U.S. Compare to Other Countries? Not Too Well, According to Some Metrics How Does the U.S. Compare to Other Countries? Not Too Well, According to Some Metrics Robert Quigley Robert Quigley Feb 23, 2011
Read Article Cocktail Recipes Explained in Infographic Form Cocktail Recipes Explained in Infographic Form Robert Quigley Robert Quigley Jan 31, 2011